Economic data released this week was positive, but capped by weaker-than-expected jobs numbers for August. This week’s basket of data is consistent with our expectations of a step-down in real GDP for the third quarter, after a strong 6.6 percent annualized gain in Q2.
U.S. payrolls increased by a net 235,000 jobs in August. The ADP Jobs Report for August was also weaker than expected. We cannot tie COVID-D directly to the weaker-than-expected jobs numbers because the data does not tell us why industries are gaining or shedding jobs, but COVID-D appears to have been a factor in August. The unemployment rate fell to 5.2 percent in August. The labor force expanded by 190,000 in August but was up by just 0.4 percent for the year ending in August, while payroll employment was up by 4.3 percent. There is a risk that we could traverse from massive job losses to a tight labor market quickly. This could potentially compound the current inflation problem and give the Fed a lot to think about.
Initial claims for unemployment insurance for the week ending August 28 fell by 14,000 to hit 340,000, continuing their easing trend. Continuing claims for the week ending August 21 fell by 160,000 to hit 2,748,000. The total number of continued claims for all unemployment benefits programs fell by 178,526 for the week ending August 14, to hit 12,186,158. We expect the claims numbers to continue to trend downward this fall.
The Challenger, Gray and Christmas Job Cuts Report for August said that U.S.-based employers cut the fewest jobs since June 1997, down 17 percent for the month to 15,723.
Light vehicle sales declined for the fourth consecutive month in August, tanking to a 13.1 million unit annual rate, according to the Bureau of Economic Analysis. The demand is there, but the cars are not as vehicle production remains throttled by global supply chain constraints. Weak auto sales in the third quarter will put a dent in consumer spending and GDP growth.
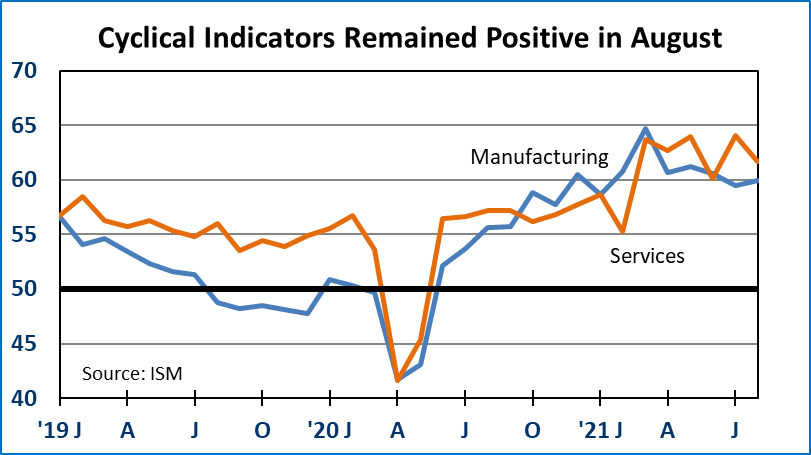
The Institute of Supply Management’s Purchasing Managers Index for U.S. Manufacturing increased in August to a positive 59.9, indicating ongoing improvement. The gain in the U.S. index stands in contrast to the Caixin Purchasing Managers Index for Manufacturing in China which went into a slight decline (just below 50) in August. For the U.S. index, eight out of ten sub-components were positive in August including new orders and production. The employment sub-index fell below 50 to 49.0, indicating reduced hiring expectations.
The ISM Services Index for August eased to a still-strong 61.7 in August, from 64.1 in July. The production, new orders and employment sub-indexes were all positive. The two inventory sub-indexes remain in contraction, below 50. Prices remained hot at 75.4, but the sub-index was down from 82.3 in July. Anecdotal comments focused on labor shortages and supply chain strain.
Total spending on U.S. construction projects increased by a modest 0.3 percent in July, even as housing starts decreased.
The U.S. international trade gap narrowed moderately in July to -$70.1 billion from -$73.2 billion in June. Exports gained $2.8 billion for the month while imports were down $0.4 billion. With one month of data for Q3, it looks like trade could be neutral for Q3 GDP, but that could easily change.
We expect the Fed to narrow the window for when asset purchases will begin to wind down at the upcoming FOMC meeting over Sept. 21/22. In his Jackson Hole speech on August 27, Fed Chair Jay Powell said that he expected tapering to start by the end of the year. December still looks like a good bet.
Dr. Robert Dye is senior vice president and chief economist for Comerica. Daniel Sanabria is a senior economist for Comerica.