• Existing home sales fell more than expected in June, with the largest decline in the West, where affordability is most stretched.
• Home sales continue to fall in July, with mortgage purchase applications down to the lowest since 2015.
• Housing starts and building permits were a little better than expected in June, but still point to lower residential investment in the second half of the year.
• Homebuilders are pivoting to multifamily from single-family houses in reaction to surging interest rates.
• Housing will be a headwind to GDP growth in the second half of 2022 and throughout 2023.
• Tight inventories of home listings make outright declines in house prices unlikely, preventing the harm to household balance sheets that made the economy so weak in the early 2010s.
Existing home sales fell 5.4% to 5.12 million annualized in June from 5.41 million in May, according to the National Association of Realtors. June’s release undershot the 5.35 million consensus and was the lowest since June 2020. Excluding the depths of the 2020 lockdown, the last time existing home sales were this low was in January 2019, when rising interest rates and the Fed’s balance sheet reduction were (like today) big headwinds to housing.
Single-family sales fell 4.8% on the month and 12.8% on the year, while condo and co-op sales fell 9.8% on the month and 24.7% on the year. By region, the biggest decline was by far in the West, where sales fell 11.1% on the month and 21.3% on the year. After the spring and summer of 2020, the last time existing home sales in the West were this low was 2010. Listings of existing homes rose to 1.26 million from 1.15 million in May; listings data are not adjusted for the typical seasonal increase during the summer months. June’s listings were up a hair from 1.23 million in the same month in 2021, but far below 1.54 million in June 2020, 1.92 million in June 2019, or 1.93 million in June 2018.
The median price of an existing home sold rose 13.4% from a year earlier to $416,000 in June and was up 1.9% from May (not seasonally adjusted). June’s year-over-year price increase was down from May’s 15.0% and the peak of 25% reached in May 2021. In June, the median price of an existing single-family house sold was $423,300 and the median condo/co-op $354,900. Single-family houses account for about 90% of the existing market. House sales continue to fall in July. The Mortgage Bankers Association’s Purchase Index, a weekly measure of mortgage applications by homebuyers, had its second-largest drop ever in the week of July 15, to 208.0 from 224.3 the week before. Aside from the spring and summer of 2020, the index is the lowest since 2015.
June’s homebuilding indicators were a little better than expected, but still point to slowdown ahead. Housing starts were 1.559 million at an annualized rate, undershooting the 1.580 million consensus. June was 2.0% below May’s upwardly-revised level of 1.591 million, but above the prior report’s 1.549 million. With a miss on the latest months’ release, but a big upward revision to May, the housing starts report was modestly better than expected on net. Building permits were a little better than expected, too, dipping 0.6% to 1.685 million annualized and above the 1.650 million consensus, after May’s unrevised 1.695 million.
Below the headlines, the single-family and multifamily segments are diverging sharply. Single family starts fell 8.1% in June, while multifamily starts jumped 15.0%. From a year earlier, single family starts were down 6.3%, but multifamily was up a big 16.4%. Similarly, single family building permits fell 1.3% on the month and also 1.3% on the year, while multifamily permits jumped 3.9% on the month and surged 42.6% on the year.
Residential units completed fell 4.6% in June to 1.365 million annualized from 1.431 million annualized in May, but were still up 4.6% from a year earlier. Housing units completed rose 15.0% annualized in the second quarter after edging up 0.5% annualized in the first quarter and increasing 8.1% annualized in the fourth quarter of 2021. Completions rose 1.8% from a year earlier in the second quarter. The rise in completions means residential investment likely added to real GDP in the second quarter. But falling starts and permits point to housing becoming a drag on GDP from the second half of the year onward. In the second quarter, starts fell 14.9% annualized after growing 10.0% annualized in the first quarter. Building permits fell even more, 24.2% annualized, after growing 20.5% in the first quarter and 24.2% in the fourth quarter of 2021.
Macro conditions were extremely supportive of housing in 2020 and 2021; prices were reasonable relative to incomes before the pandemic struck, and then the Fed lowered mortgage rates to historic lows to cushion the crisis’s blow to the economy. Now macro conditions have become extremely adverse to housing. Considering median incomes, median house prices, and prevailing mortgage rates, housing affordability is the worst since 2006, according to the National Association of Realtor’s Housing Affordability Index. Abysmal consumer confidence, recession fears, and the sell-offs in stocks are further headwinds. And housing markets in tech-centric metro areas concentrated on the West coast also must contend with the tech industry’s slowdown, lower tech company valuations, and cratering cryptocurrency prices, which are a pain point for some first-time buyers.
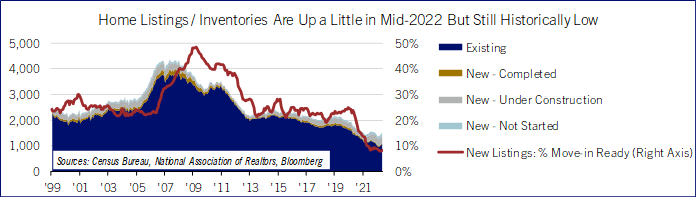
After being a big support of the recovery over the last two-plus years, Comerica forecasts for residential investment to contract from mid-2022 through mid-2024 as the market adjusts to higher interest rates. Over this period, construction will shift even more from the single-family segment to multifamily. Despite the headwinds to housing, national year-over-year price declines still look unlikely. The rise of remote work and other pandemic-related lifestyle changes have permanently increased demand for living space. And housing inventories are very low—the inventory of existing homes for sale, while up in June, is still down considerably from before the pandemic, and less than one in ten new homes listed for sale is move-in ready (See chart). These are very different supply conditions than those that prevailed in the early 2000s, when the housing boom went bust and contributed to the Great Recession.
Bill Adams is senior vice president and chief economist at Comerica.